Jackson Mumper
GIS and Academic Portfolio
Project maintained by jackson-mumper Hosted on GitHub Pages — Theme by mattgraham
Introduction
In their 2020 paper, Kang et al conduct a vulnerability model of hospital capacity and accessibility in relation to the COVID-19 pandemic in Illinois. By using largely open source methods and data, they use CyberGIS to calculate hospital catchment areas based on driving time, followed by a bed-to-population ratio for each hospital location. The final products ad re two hospital accessibility maps, one of Illinois and one of Chicago, aggregated based on a hexagonal raster.
The recent publication of the source code from this study in a Jupyter notebook, as well as their use of widely available datasets like OpenStreetMap, allows for both public reproduction of their methods, and alteration of their methods when changes can/should be made. This replication has two main goals:
- To correct for a key error in the way hospitals and the road network connect in Chicago
- To assess the impact of the weights with regard to the Modifiable Aerial Unit Problem (MAUP)
Materials and Methods
The original Kang et al study uses a Python script in CyberGIS and as well as data from the following sources:
- Population and demographic data at the census tract level from the 2018 5-Year ACS Reports
- A road network taken from OpenStreetMap using the OSMnx Python package
- Hospital locations and information from IDPH
- A hexagonal grid from an unknown source
The authors begin by calculating catchment areas for each hospital in Chicago. They do this by first attaching hospitals to the road network at the node nearest each hospital, then using catchment areas based on 10, 20, and 30 minute driving times to those hospital nodes. The driving time networks are based on the speed limits listed with the roads in OpenStreetMap, assuming a 35mph speed limit when not listed or as listed invalidly (such as in string format).
However, because the authors use hospitals from outside the Chicago city limits, but limit their road network to this extent, hospitals that are outside the city are moved multiple miles when they are placed within the road network. This creates a startling edge effect problem, wherein driving times to hospitals is severely underestimated on the outer boundary of the road network.
These catchment areas are then weighted and combined with the final population and demographic data, and finally aggregated to the hexagonal grid to produce the finalized map of hospital accessibility.
This two key changes made in this replication are the expansion of the road network, and a changing of the distance weights. The former change is made to account for the edge effects of hospitals connecting to a road network that does not cover the extend of hospitals in the study. The road network was extended using a 25 mile buffer around the city of Chicago, similar to the 25 mile buffer used by the authors in their query for hospitals. The latter is made to test the importance of the weights. The weights used in the original study are summarized below, along with the weights used in this replication:
| Distance From Hospital | Original Weight | New Weight |
| 10 Minutes | 1.0 | 1.0 |
| 20 Minutes | 0.68 | 0.75 |
| 30 Minutes | 0.22 | 0.25 |
The underlying assumption made with the original weights is that 100% of people will driving 10 minutes to a hospital, 68% will travel 20 minutes, and 22% will travel 30 minutes. However, the original authors give no mention of the reason these values were chosen, and they have seemingly been chosen at random. This analysis changes these weights to 1, 0.75, and 0.25, respectively. By comparing the results when using a different set of weights, one can see how sensitive the analysis is to them. If changing the weights causes significant changes in the final result, it may be important to consider how these weights are chosen, and more explicitly explain how they have been derived.
Results and Discussion
Figures 1-3 below show the process of change that took place with each adjustment to the code.
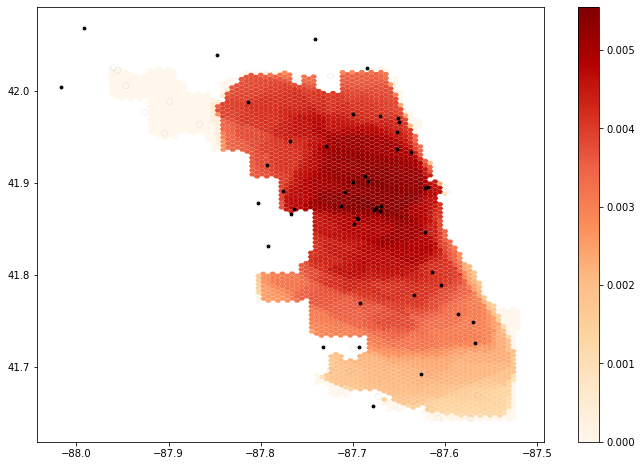 Figure 1: Original Findings of Kang et al
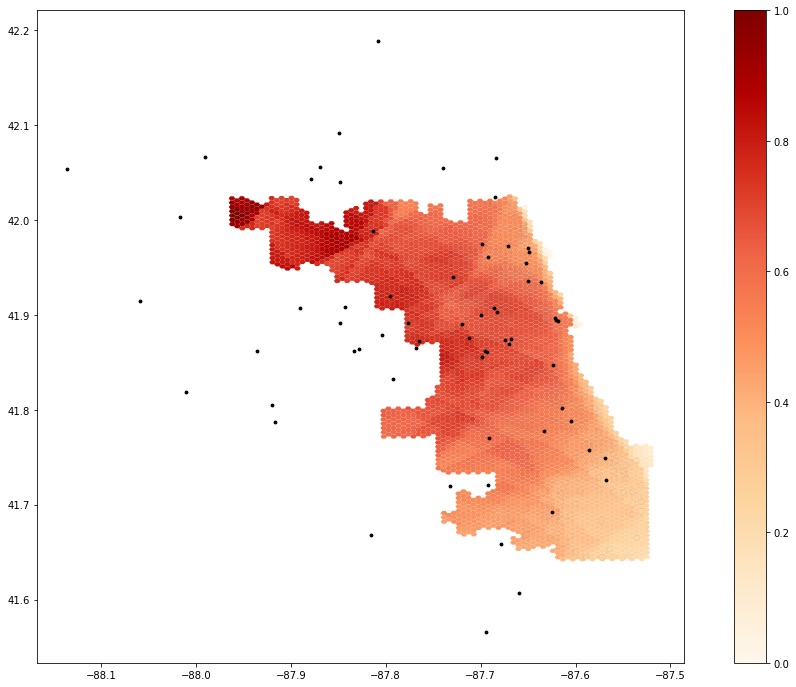 Figure 2: Adjusted results for network design improvements
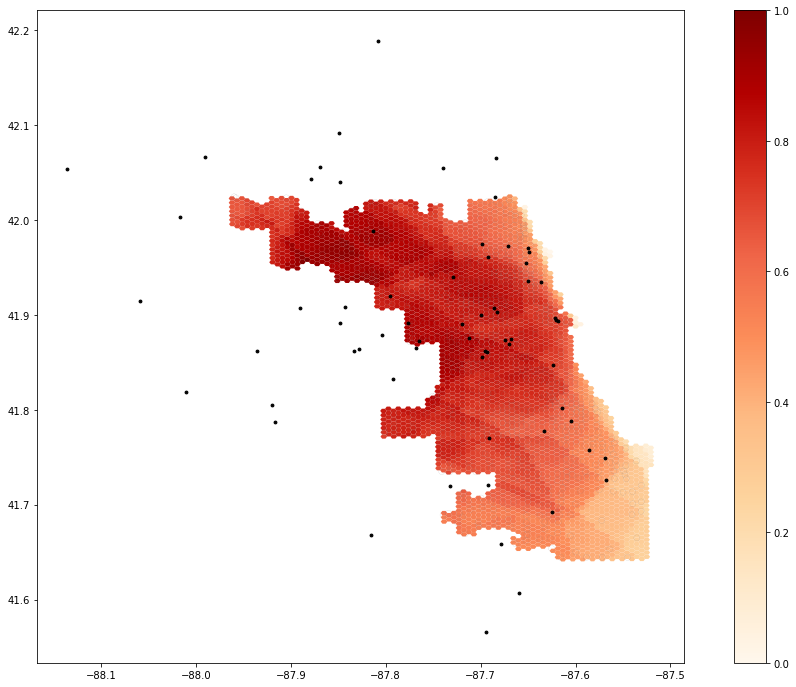 Figure 3: Adjusted results from Part 1 with new weighting schema
The adjustment from Figure 1 to Figure 2 results in some noteworthy changes in the distribution of hospital accessibility across the city. In particular, areas of the highest accessibility move from center of the city to its northwestern edge. It’s unclear why this change took place, as if anything, moving hospitals away from the city’s edge should do the opposite. However, in the original map, this part of the city, as well as what appear to be hospitals in it, are represented in a way inconsistent with the rest of the map. It’s unclear how the authors calculated hospital accessibility in this part of the city or what the symbology in this region represents. However, the extension of the road network does make a meaningful difference in the final interpretation.
The change from Figure 2 to Figure 3, however, is much less noticeable. While the new weighting scheme does change the degree of hospital accessibility in certain parts of Chicago, the overall trends do not change. This shows that while a theoretical basis for the weights could be useful, it is not necessary so long as they decrease as driving time increases. The results are thus not widely affected by the modifiable areal unit problem, providing efficacy to the authors’ conclusions.
Overall, replication of this study proved much easier than other replications from this class. The compilation of source code in a Jupyter notebook proved to be an invaluable tool, particularly with regard to modifying the results. There were still, however, a few sources of unresolved confusion in the replication. For example, a comment explaining that the purpose of one line of code was to “exclude the weirdo.” In addition, some of the data sources, such as the hexagon layer, are automatically loaded into the Jupyter notebook and it is unclear from where they were derived.
The final GitHub repository for this replication can be found here.
Conclusion
This reproduction study of Kang et al’s hospital accessibility analysis demonstrates some important aspects of what open source movements in GIS seek to accomplish. While the original study has useful and meaningful results, publishing the code allows readers to make their own contributions to the research, finding errors in code or conception, which in turn contributes to an ongoing peer review process. In the case of this replication, while the original findings stand overall, some adjustments in execution (namely extending the road network to encompass all relevant hospitals) can provide greater nuance and confidence in the findings.
References
Kang, J. Y., A. Michels, F. Lyu, Shaohua Wang, N. Agbodo, V. L. Freeman, and Shaowen Wang. 2020. Rapidly measuring spatial accessibility of COVID-19 healthcare resources: a case study of Illinois, USA. International Journal of Health Geographics 19 (1):1–17. DOI:10.1186/s12942-020-00229-x.
Thank you to Professor Joe Holler, Kufre Udoh, and the rest of the Geog323 class for the collaborative spirit and aid in this project.