Jackson Mumper
GIS and Academic Portfolio
Project maintained by jackson-mumper Hosted on GitHub Pages — Theme by mattgraham
Gravity Model of Spatial Interaction
This project involved creating a gravity model of spatial interaction to estimate the coverage extents of hospitals in New England. It does this by assuming people will go to hospitals that are nearest to them and that have more beds. By looking at these three factors, one can create hospital catchment areas that show what hospitals people would be most likely to go to.
About the Preprocessing Model
In order to prepare the hospital data to be used in the model, there was some preprocessing that needed to be done. The image below shoes the workflow used in the hospital preprocessing.

The model workflow went goes through 7 steps as outlined below.
- Extract by expression on the hospitals that are open. (“STATUS” = ‘OPEN’)
- Extract by expression only hospitals that reported the number of beds they had. (“BEDS” > 0)
- Extract by expression only relevant hospitals to the analysis. (“TYPE” = ‘WOMEN’ OR ‘CHILDREN’ OR ‘GENERAL ACUTE CARE’ OR ‘CRITICAL ACCESS’)
- Calculate a new place_id field by concatenating the STATE and CITY fields in the data. This is to ensure each town has a unique place name, since some town names can repeat in multiple states.
- Extract by expression only hospitals in New England or New York. I chose to include New York hospitals as data buffer, even though the relevant study area is only New England.
- Aggregate hospitals within the same town (using the newly calculated place_id field). This is so that nearby hospitals that may have more resources split amongst them than hospitals of their size typically would have appropriate weight in the model.
- Find the centroids of all hospitals within each town to use as the new geometry of the pre-processed hospitals.
The result of this model, available here, from the input data was a new hospital points layer that was appropriate as an input in the gravity model.
About the Gravity Model
In order to create the hospital catchments, I created a gravity model in QGIS. The gravity model, available here, is designed to be a more generalizable model that can be used in more analyses than this one. An image of the model can be found below.
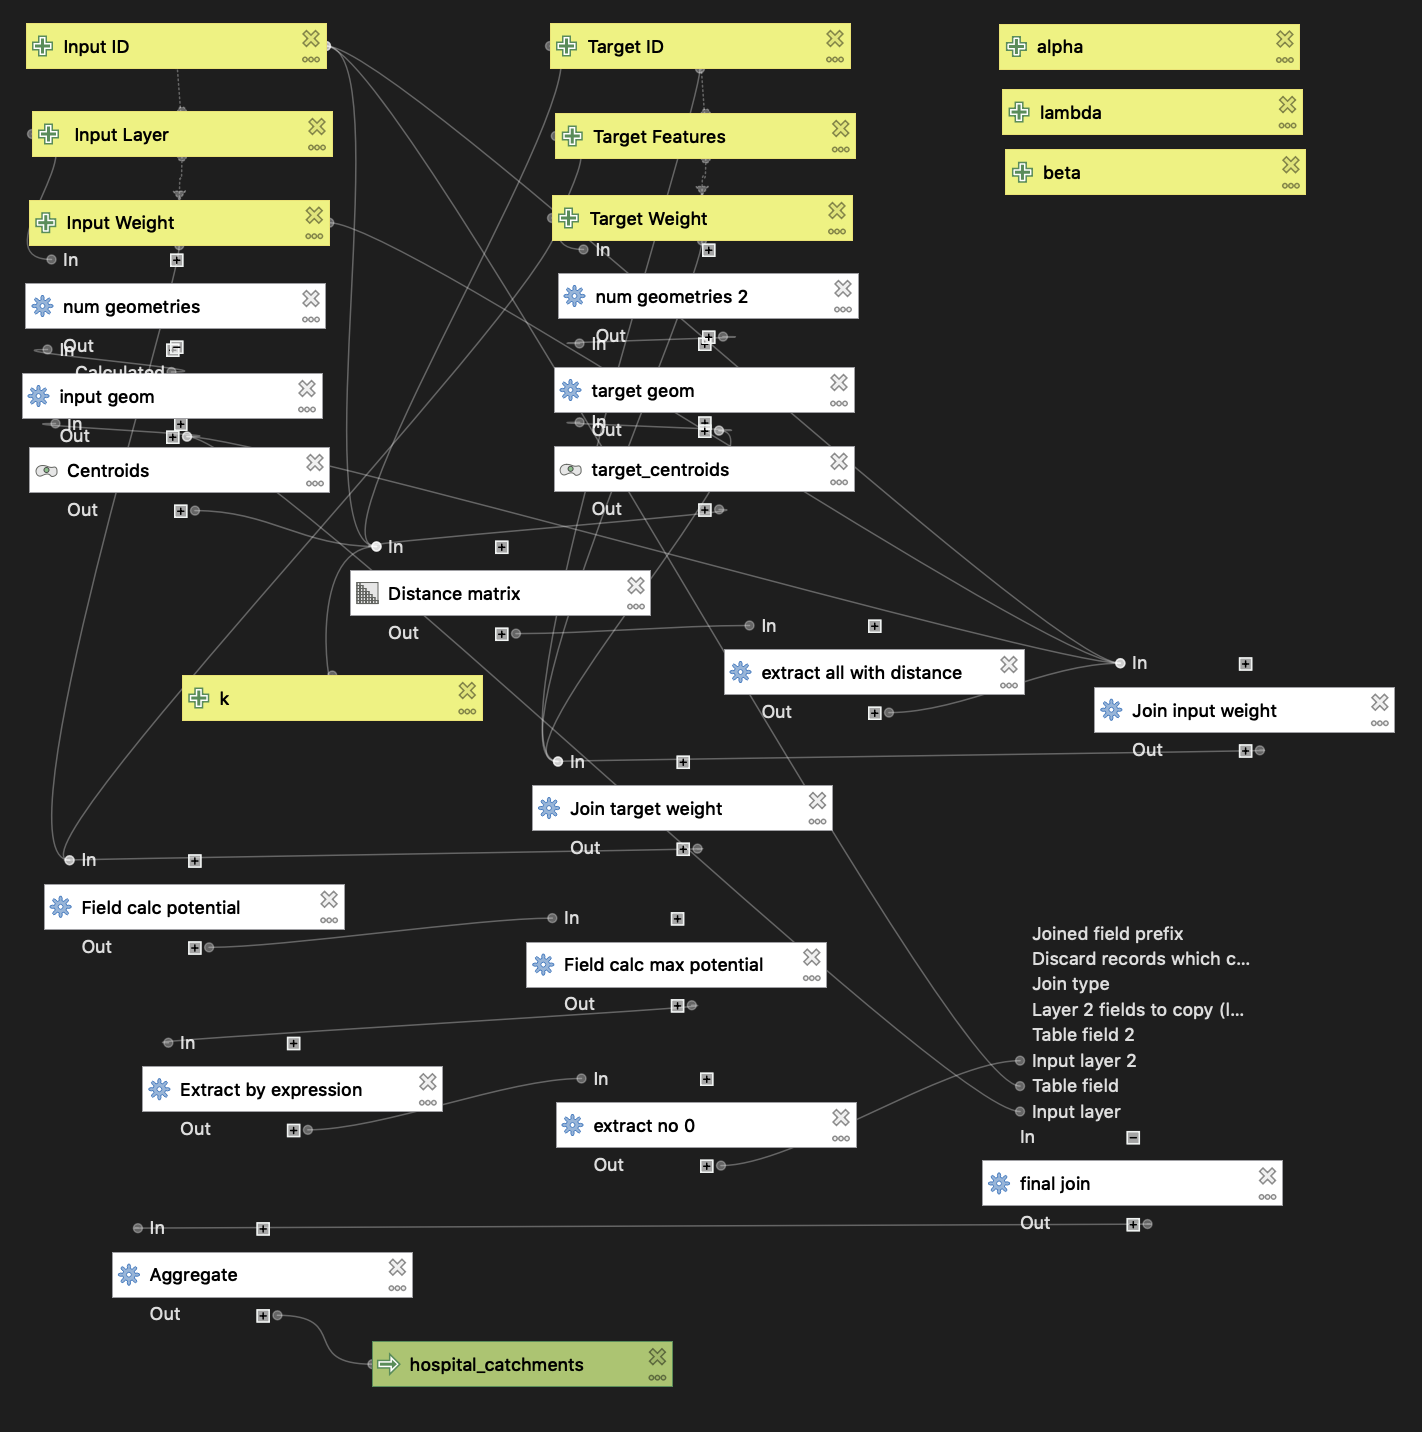
And a download link for the model is available here.
The gravity model takes input and target layers, each with specified ID and weight fields, as well as four advanced options, k, lambda, alpha, and beta. I assigned default parameters for these as 20, 1, 1, and 2 respectively, and left those parameters in my analysis.
Dartmouth HSA Comparison
A map of the hospital catchment areas that I found when compared to the Dartmouth Atlas can be found here.
As you can see, there are several differences between the hospital regions found by my model and the Dartmouth Hospital Service Areas. My model places a much stronger reliance on beds than distance when compared to the Dartmouth HSAs. Springfield, MA, for example, has a catchment area in my analysis that includes almost all of western Massachusetts as well as much of northern Connecticut, totally over 3 million people, despite there being several other hospitals in the region. In future iterations of this project I would decrease the friction of distance to adjust this skewed result.
There are a few other adjustments I would make in future iterations of this analysis. For example, the current distance matrix calculates distance as the crow flies, ignoring barriers in the physical distance that affect travel time. Including a network layer would solve this problem, making the map not imply that one should walk across Lake Champlain to get from Port Henry, New York to Burling, Vermont. I also plan to update the online map to be easier to read and prettier to look at in the near future. Stay tuned!
Data Sources