Jackson Mumper
GIS and Academic Portfolio
Project maintained by jackson-mumper Hosted on GitHub Pages — Theme by mattgraham
Rosgen Classification of River Systems
Original study by Rosgen, D. L. in CATENA 22 (3):169–199. https://linkinghub.elsevier.com/retrieve/pii/0341816294900019.
and Replication by: Kasprak, A., N. Hough-Snee, T. Beechie, N. Bouwes, G. Brierley, R. Camp, K. Fryirs, H. Imaki, M. Jensen, G. O’Brien, D. Rosgen, and J. Wheaton. 2016. The Blurred Line between Form and Process: A Comparison of Stream Channel Classification Frameworks ed. J. A. Jones. PLOS ONE 11 (3):e0150293. https://dx.plos.org/10.1371/journal.pone.0150293.
Replication Authors: Jackson Mumper, Zach Hilgendorf, Joseph Holler, and Peter Kedron.
Replication Materials Available here.
Created: 27 March 2021 Revised: 25 May 2021
Introduction
This project is a replication of Kasprak et al. and their classification of the Middle Fork John Day Basin, along the Columbia River in northeastern Oregon. Kasprak et al. used multiple stream classification systems on this section of the river, but for this analysis, we only sought to replicate their findings using the Rosgen Classification System (RCS), and only for one study location - a point along Vinegar Creek. Replication is an important aspect of scientific research, including GIS research, to ensure with extra certainty the validity and efficacy of findings.
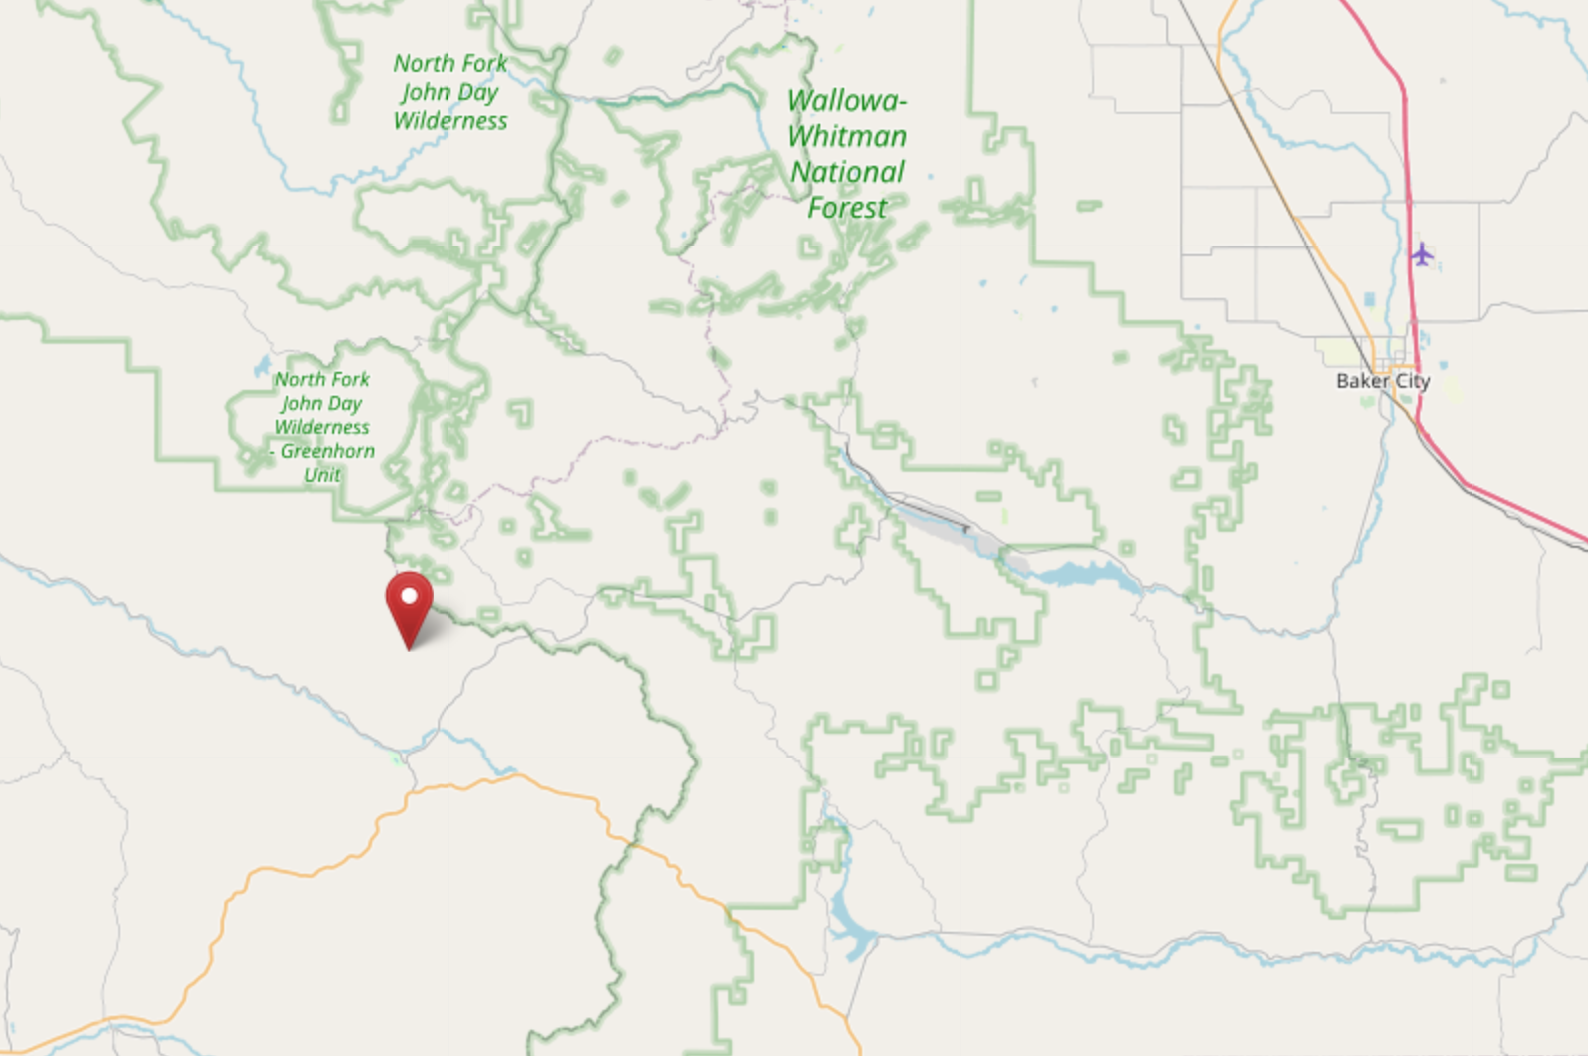 Map of analysis point in relation to Baker City, OR.
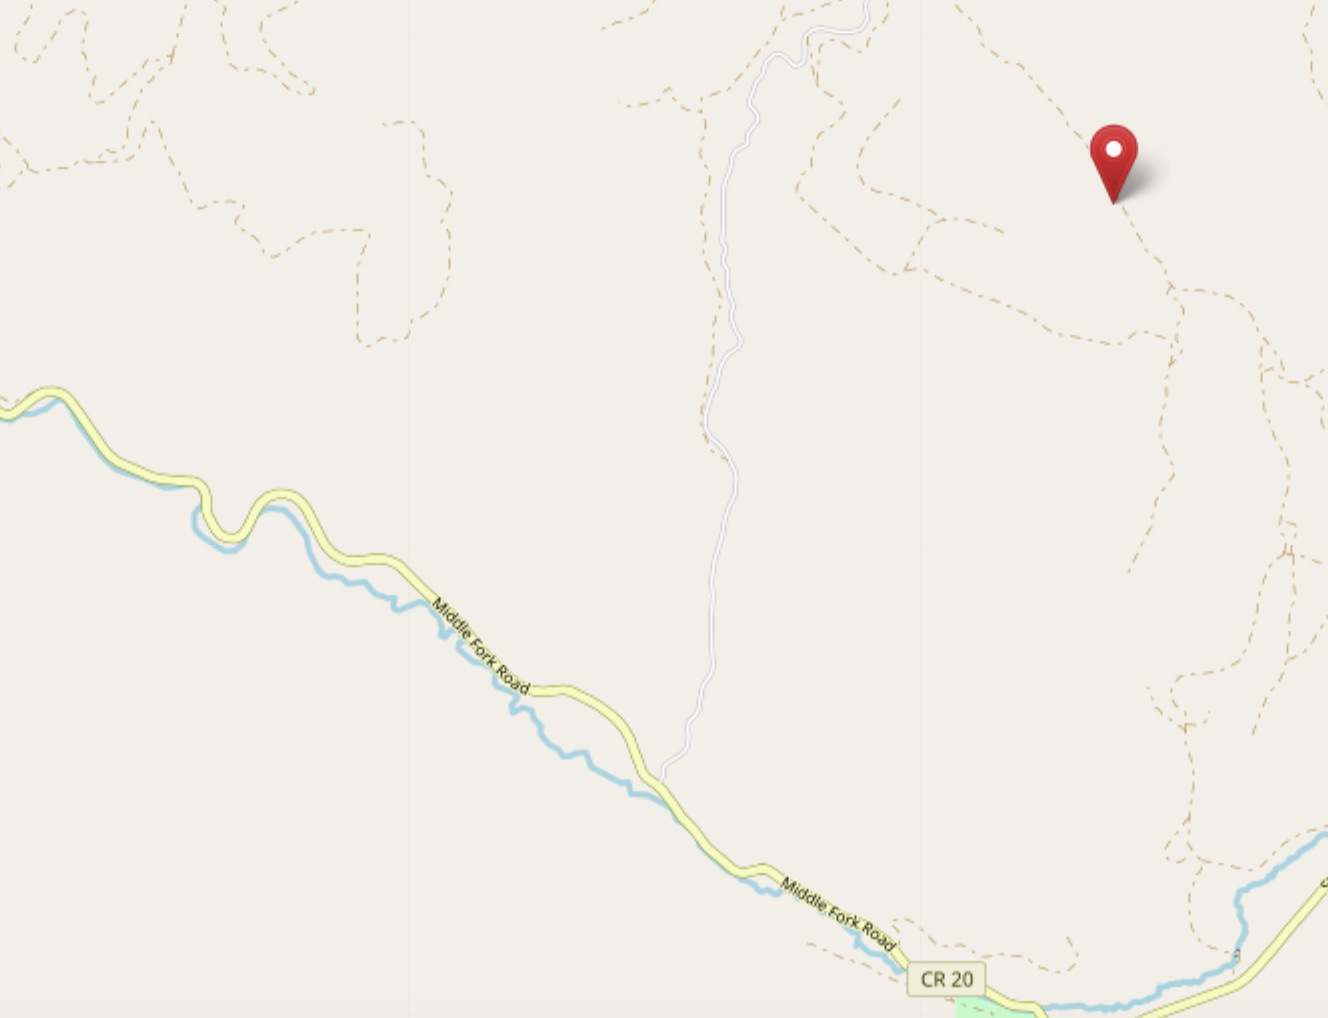 Map of analysis point in relation to larger river and highway.
Methods
Both Kasprak and I followed the RCS to create Level I and II classifications using LiDAR DEM data of the study area. While Kasprak ran their analysis using ArcGIS, I used the open source GRASS GIS software.
I ran two models on the original CHaMP data in GRASS GIS software. The two models can be found in the RE-rosgen repository above. The first of these was to visualize the study point (loc_id=21) within the surrounding area. I used the resulting relief and slope maps to digitize the river and valley banks. These maps can be found below.


After digitizing the river banks and valley edges, I calculated river and valley centerlines as well as transects of the river. The data I extracted from these were then used to create longitudinal and cross-sectional profiles of the river in this location in R. From these profiles, I followed the Rosgen classification workflow, shown below.
Results and Discussion
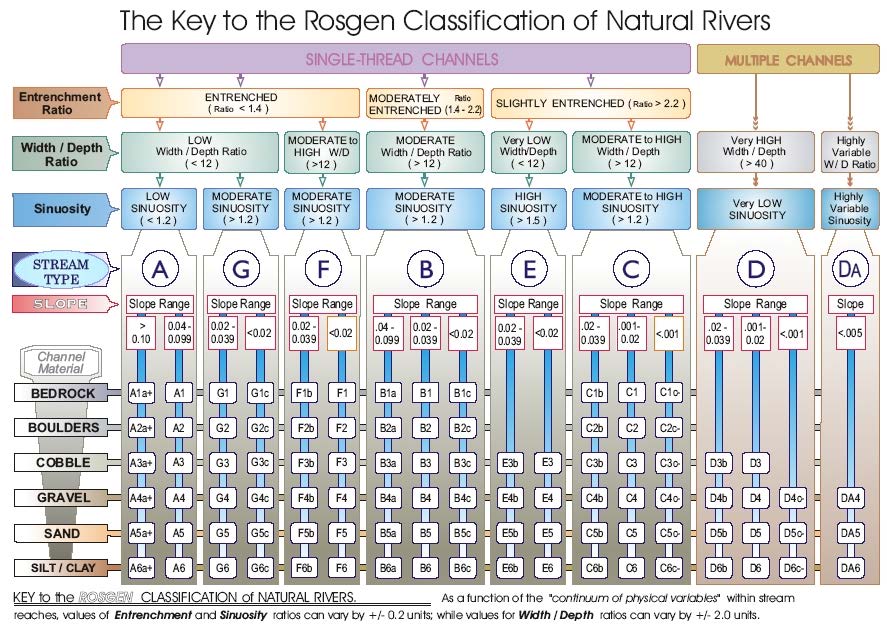
My analysis of Vinegar Creek concluded it to be a type C4 stream, slightly different than Kasprak’s C4b. The process by which I came to this conclusion is shown in the tables below.
| Variable | Value | Source |
|---|---|---|
| Bankfull Width | 5.67m | CHaMP data |
| Bankfull Depth | 0.77m | CHaMP data |
| Valley Width | 43m | R Analysis of Transects |
| Valley Depth | 1.55m | 2x Bankfull Depth |
| Stream/River Length | 129.3m | GRASS Output: Banks Centerline |
| Valley Length | 128.7m | GRASS Output: Valley Centerline |
| Median Channel Material Particle Diameter | 45 | CHaMP data |
| Criteria | Value |
| Entrenchment Ratio | 7.76 |
| Width/Depth Ratio | 55.6 |
| Sinuosity | 1.00 |
| Level I Stream Type | C |
| Critera | Value |
| Slope | 0.017 |
| Channel Material | Gravel |
| Level II Stream Type | C4 |
Kasprak and I both found that this section of the stream was only slightly entrenched, with a moderate to high width to depth ratio. This implies that the stream is a type C in the RCS.
However, my calculated value for sinuosity was only 1.00, much lower than the expected minimum value of 1.2 for a stream of this type. While I initially thought this meant my stream could not be classified using the RCS, further inspection reveals that Kasprak found a sinuosity value of 1.15, which while higher than my value, is also below the threshold. Kasprak proceeds to classify the stream as type C anyway, ignoring the slight deviation. Because of this, I have also proceeded with a type C classification for this analysis.
The variable that ultimately led to our different results was slope. This may have been the result of my inexperience with river digitization. By drawing the river banks based solely on the slope and relief maps, I often found myself unsure of how my lines related to the underlying landscape. This is particularly noticeable on the eastern bank of the river. This introduced a lot of noise into the data, affecting the rivers final location on the map, as well as the final longitudinal profile. The longitudinal profile, as well as a cross sectional profile of the river, are found below.
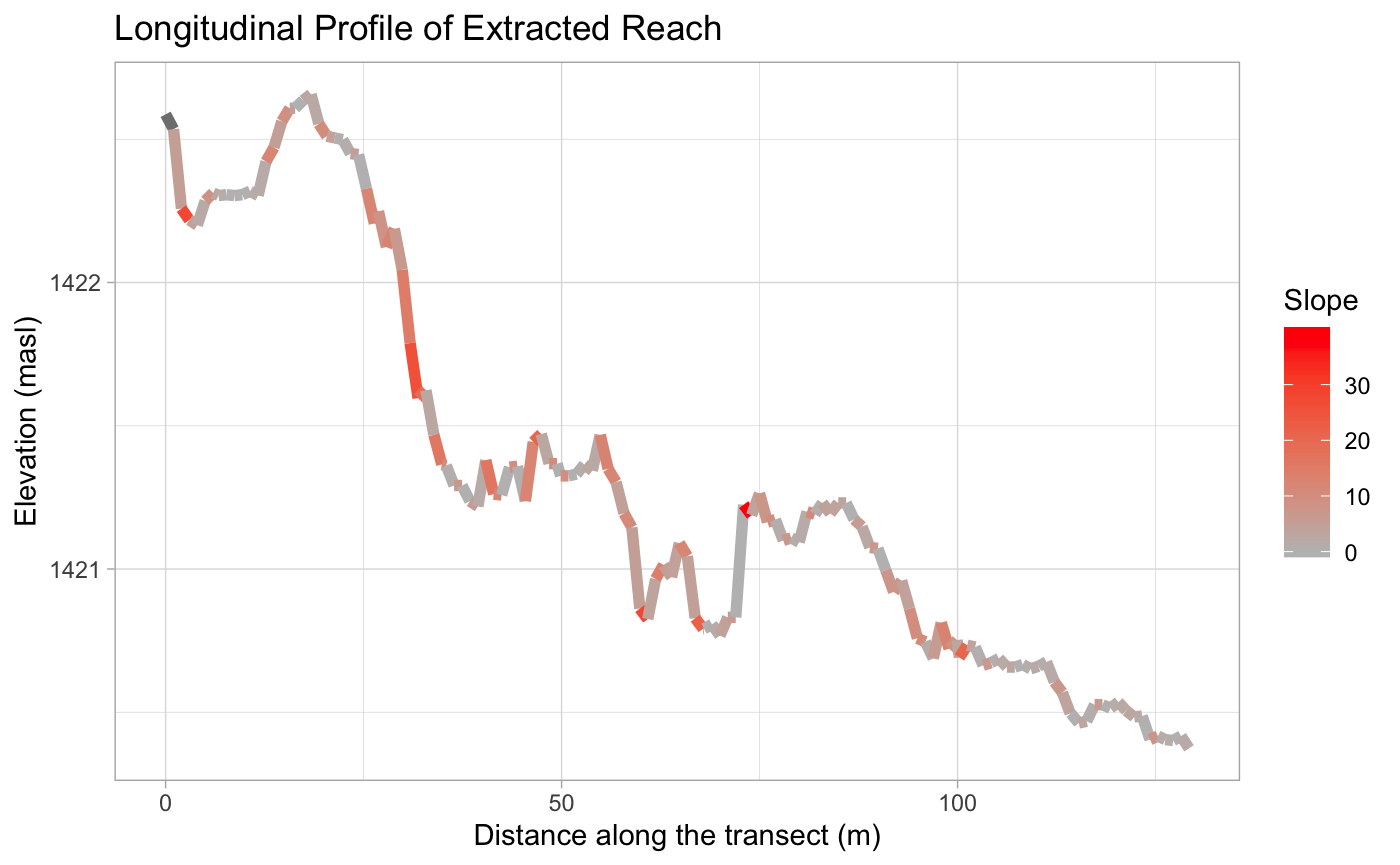
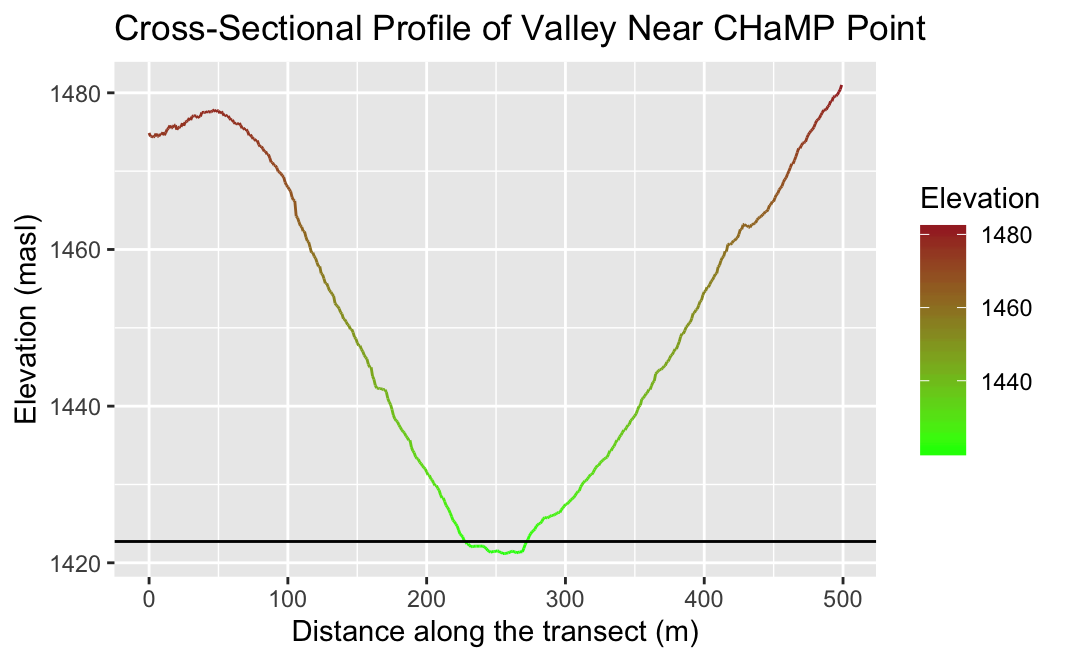
Given that the longitudinal profile shows the river going up in certain places, it is probably unwise to trust in this as a tool for classifying the river. The lines I used to digitize the valley and river banks, and from there calculate the valley and river centerlines in the study area, are found below.
 Map of Digitized Valley Floor
 Map of Digitized River Banks
Conclusion
Despite inconsistencies in digitizing the river banks and a lack of on-the-ground knowledge and experience in northeastern Oregon, this replication analysis has found the site on Vinegar Creek to be roughly the same stream type under the Rosgen Classification System as Kasprak et al.
References
Kasprak, A., N. Hough-Snee, T. Beechie, N. Bouwes, G. Brierley, R. Camp, K. Fryirs, H. Imaki, M. Jensen, G. O’Brien, D. Rosgen, and J. Wheaton. 2016. The Blurred Line between Form and Process: A Comparison of Stream Channel Classification Frameworks ed. J. A. Jones. PLOS ONE 11 (3):e0150293. https://dx.plos.org/10.1371/journal.pone.0150293.
Rosgen, D. L. in CATENA 22 (3):169–199. https://linkinghub.elsevier.com/retrieve/pii/0341816294900019.
OpenStreetMap Contributors
Thank you to Professor Joe Holler, Kufre Udoh, and the rest of the Geog323 class for the collaborative spirit and aid in this project.