Jackson Mumper
GIS and Academic Portfolio
Project maintained by jackson-mumper Hosted on GitHub Pages — Theme by mattgraham
Replication of
Spatial, temporal and content analysis of Twitter data
Original study by Wang, Z., X. Ye, and M. H. Tsou. 2016. Spatial, temporal, and content analysis of Twitter for wildfire hazards. Natural Hazards 83 (1):523–540. DOI:10.1007/s11069-016-2329-6. and First replication study by Holler, J. 2021 (in preparation). Hurricane Dorian vs Sharpie Pen: an empirical test of social amplification of risk on social media.
Replication Author: Jackson Mumper
Replication Materials Available at: RE-Dorian
Created: 17 May 2021
Revised: 25 May 2021
Abstract
As the digital age progresses, social media becomes a larger part of people’s daily lives. Many human interactions now take place through the internet, often times within the public eye. This allows for an unprecedented ease of communication and knowledge-sharing across space, that would have been unthinkable only a few decades ago.
One major player in this transformation is Twitter, which allows users to post, privately or publicly, about whatever they choose. While social media platforms such as Twitter are often described as having cultures of their own, these cultures stem from real-world human phenomena, and the place-based events that take place in one’s life. Therefore, the geographic data stored by Twitter and its peer sites may be useful in analyses of real-world geographic study. However, it may be hindered by this same ease of communication, if those not geographically near an event are engaging with it online.
This is evident in a growing body of geographic research about Twitter. Wang et al (2016), for example, analyzed Twitter data for wildfires in California, finding that the social media data can be useful in tracking the spatial extent of disasters. Holler (2021) is studying Twitter data for Hurricane Dorian on the Atlantic coast, finding that in spite of tending news and social media content regarding a false narrative of risk, original Tweets still clustered significantly along the real hurricane track, and only along the hurricane track.
In his replication study, I will use similar techniques to Wang et al and Holler to map US Twitter activity about the May 2021 collapse of the Mexico City Metro Line 12. This will be useful to assess spatial and emotional impacts of disasters beyond their immediate reach, and to understand the degree and types of noise that may be expected in social media analyses in the future.
Original Study Information
Wang et al (2016) conduct an analysis of Twitter activity during California wildfires between May 13 and May 22, 2014, using the Twitter search API. The first phase of Wang et al’s study found tweets with key words “fire” or “wildfire,” while the second involved pruning this dataset to only those that also contained terms “Bernardo” or “San Marcos,” the two fires they were studying, and limited to a geographic extend of within 40 miles of downtown San Diego. They analyzed tweets that met these criteria and were sent with geographic metadata through various methods. The first was done by calculating a kernel density estimation (KDE), and a Dual KDE to normalize for population. Next, text mining was undertaken to analyze the content of these tweets, including word pairs that often co-occurred in tweets and a metadata analysis of the temporal characteristics of wildfire tweets. Finally, they conducted a network analysis of the retweet network to show how interconnected people’s voices were, and to illustrate common threads of communication on the platform.
Holler (2021) loosely replicated the methods of Wang et al (2016) for the case of Hurricane Dorian’s landfall on the U.S. mainland during the 2019 Atlantic Hurricane season. Data was based on Twitter Search API queries.
Holler modified Wang et al’s methods by not searching for retweets for network analysis, focusing instead on original Tweet content with keywords hurricane, Dorian, or sharpiegate (a trending hashtag referring to the storm). Holler modified the methodology for normalizing tweet data by creating a normalized Tweet difference index and extended the methodology to test for spatial clustering with the local Getis-Ord statistic. The study tested a hypothesis that false narratives of hurricane risk promulgated at the highest levels of the United States government would significantly distort the geographic distribution of Twitter activity related to the hurricane and its impacts, finding that original Twitter data still clustered only in the affected areas of the Atlantic coast in spite of false narratives about risk of a westward track through Alabama.
Wang et al (2016) conducted their study using the tm and igraph packages in R 3.1.2. The replication study by Holler (2021) used R, including the rtweet, rehydratoR, igraph, sf, and spdep packages for analysis.
Materials and Procedure
This study analyzes US tweets from within a 1000 mile radius of the location at 41 degrees north, 112 degrees west. This radius more or less encompasses the western United States, from Texas and North Dakota, to the Pacific coast. This region was chosen to include the parts of the country with the most people of Mexican ancestry, who could be more likely to be impacted by the CDMX metro collapse. Tweets with encoded geographic data made between April 28 and May 6, 2021 were processed in the study, and those containing the keywords “metro” “collapsed” or “colapsó” were flagged as being related to the event in Mexico City (with colapsó being the Spanish word for collapsed). The status_id’s of the final tweets can be found here.
The first portion of this analysis involved observing patterns in the language of CDMX-related tweets, to create the bar chart and network graph in Figures 2 and 3. During this process, the original keywords (“metro”, “collapsed”, and “colapsó”) were excluded, as well as a list of English and Spanish stop words. English stop words were found using the tm package in R, while the full list of Spanish stopwords can be found here.
The final portion of this analysis aggregated the spatial distribution of these tweets by county, and normalized them based on the most recent census population estimates (drawn using the tidycensus R package). After this, local Ord G statistics of CDMX-twitter activity were calculated for each county, as well as z-scores of those values. The final product, a map of the significance values of those z-scores, revealing spatial clusters of metro collapse tweets, is found in Figure 5.
Replication Results
The search query found 495 tweets that included a keyword as well as spatial data (typically from one’s location services on their phone). While there were few tweets with spatial data made using the key terms during this timespan, there was, as predicted, a sharp rise in tweets around and shortly following the May 4th disaster, which maintained higher baseline levels for the following days. This is demonstrated in Figure 1.
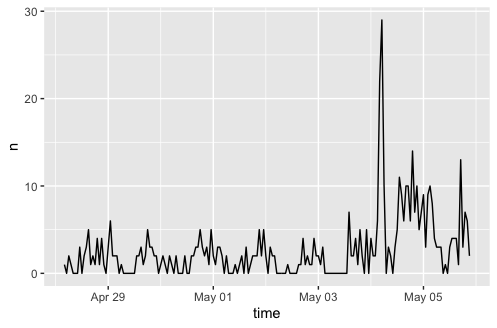
Figure 1: Temporal Patterns in Key Word Tweets
This corroborates one’s expectations as a clue that a twitter analysis of this type may reflect outside world phenomena. Looking more closely at the subject matter in these tweets paints a clearer picture of the twitter discourse taking place during this time.
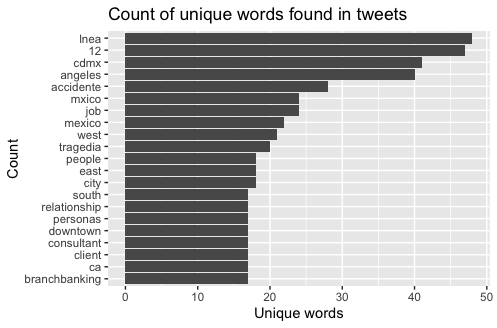
Figure 2: Chart of Most Common Words in Metro Tweet
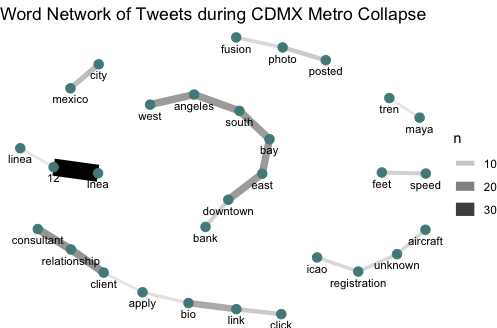
Figure 3: Network Map of Metro Tweet Word Pairs
The bar chart in Figure 2 shows what words were most likely to coincide with the key words in tweets made during this timeframe. The most common words found were “lnea,” “12,” and “cdmx.” These show that many of the tweets sampled were about the metro collapse. “Lnea” is a misspelling of the Spanish word “línea,” meaning line, as in a metro line, and it was line 12 that collapsed in Mexico City (abbr. CDMX). There are also several other words in the chart that show similar themes, such as “mxico” and “mexico,” “accidente,” and “tragedia.” Most of the words explicitly related to the metro collapse are in Spanish, indicating the Spanish-speaking twitter users were more likely to be discussing the event. The word network in Figure 3 further illustrates these findings, as words like “lnea” and “12” showed a strong degree of mutual occurrence in the tweets. However, there appear to be unrelated threads that were common in the data, and it is unclear what these tweets clusters are about. It is likely that these tweets were unrelated to the tragedy in Mexico, which would pose challenges to these results. Further investigation is needed to determine what other themes were present in the data, as well as how their inclusion may have altered the resulting figures.
Taking a geographic perspective on this twitter data, most tweets were taken from urban locations, such as metropolitan Los Angeles, San Francisco, and Dallas/Fort Worth, as shown in Figure 4. This is to be expected, as high density locations have more people to tweet. Analyzing hot spots of Twitter data, normalized by population, shows a clearer picture of where CDMX tweets were made, and is shown in Figure 5.
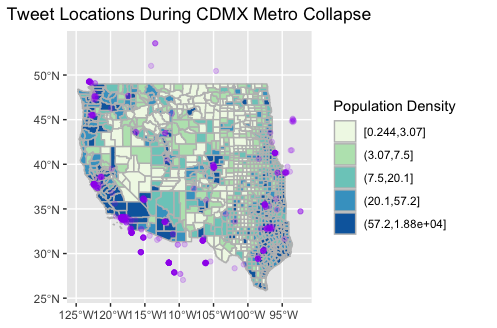
Figure 4: Map of CDMX Tweet Locations
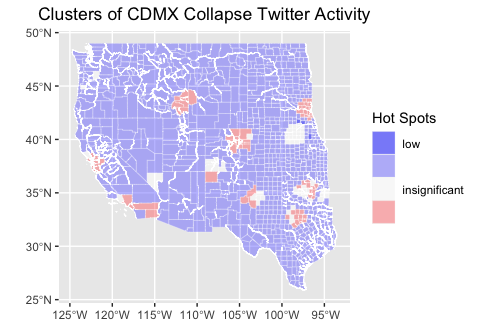
Figure 5: Hot-Spot Analysis of Twitter Activity
While most counties had lower-than-average discussion of the metro collapse, there were a few pockets of greater activity, particularly in southern California, The San Francisco Bay area, Colorado’s Front Range, Greater Sioux Falls, Oklahoma City, Dallas/Fort Worth, and eastern Idaho. Comparing this with data on Mexican ancestry in the United States shows interesting results. While some places with larger Mexican populations, such as eastern Idaho, saw greater Twitter activity, by and large Twitter activity tends to cluster more with certain urban areas rather than Mexican ancestry. This clustering is not the result of population differences, as the data have already been normalized. Further analysis is needed to determine what these cluster locations have in common between them.
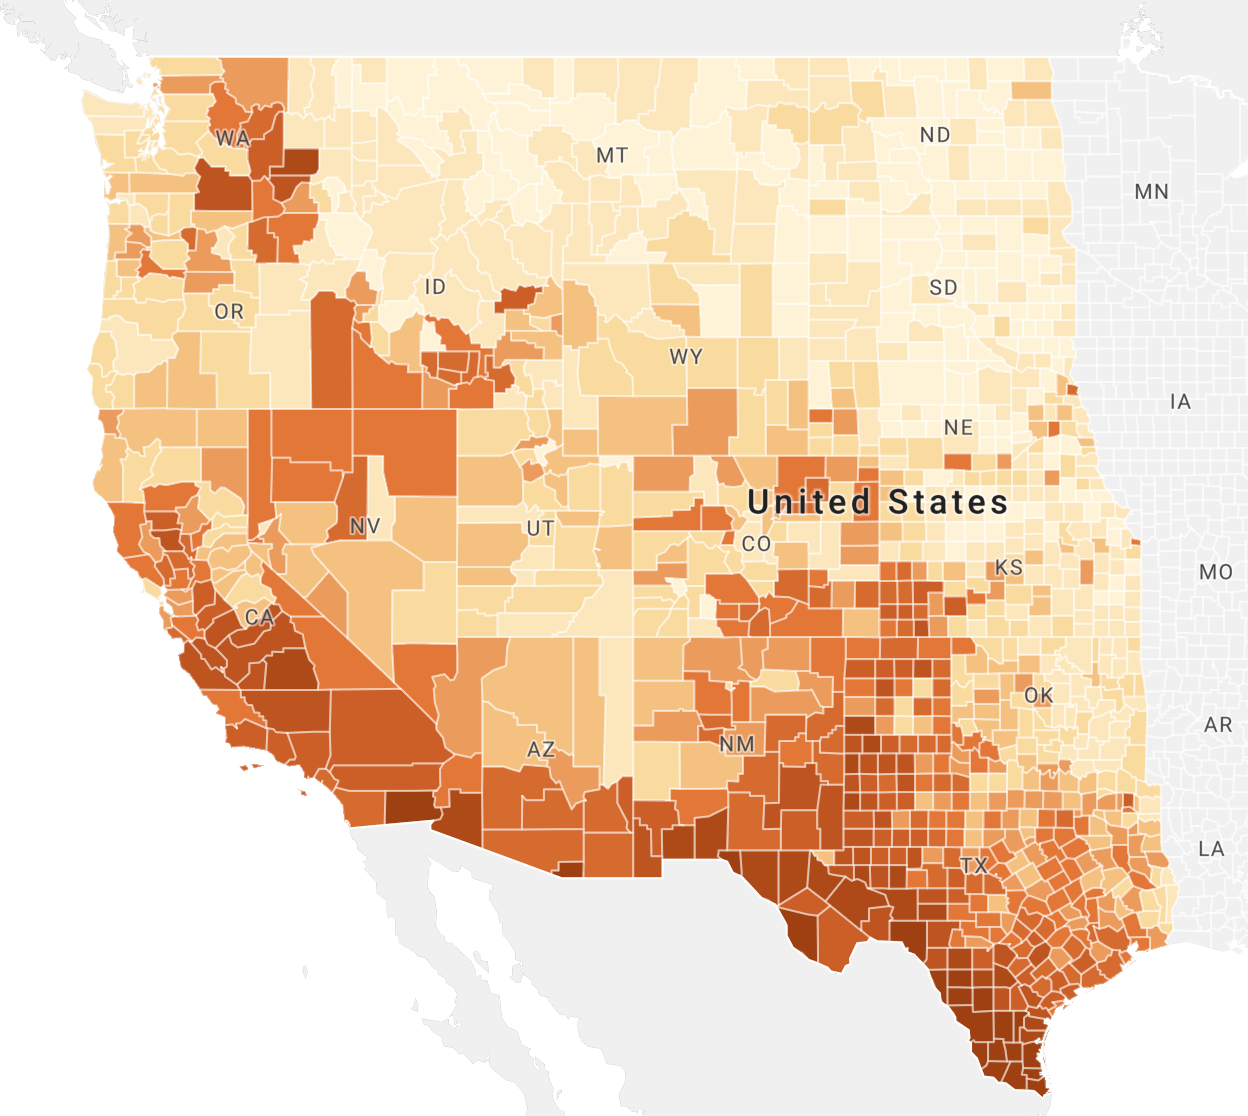
Figure 6: Mexican Ancestry in the Western United States (from Social Explorer, Jenks natural breaks with 11 classifications)
Unplanned Deviations from the Protocol
Running an analysis with Spanish-language tweets in a software environment designed for English speakers posed challenges to this analysis. hen confronted with characters that are not standard in English (accented vowels and ñ). As a result, misspellings found their way into the analysis, such as “lnea” (a misspelling of “línea”), as shown in Figure 2. While this shouldn’t have changed the final results, as each word was consistently misspelled, it speaks to larger questions of translations and linguistic capacity in GIS.
Discussion
While the filtering of Twitter data proved useful in finding tweets about the CDMX metro collapse, the geographic distribution of these tweets provides little insight, at least on a surface level, useful data about the broader impacts of this disaster. Because this analysis wasn’t located at the location of the event, it neither supports nor contradicts the findings of Wang et al or Holler. However, when viewed as an attempt to find potential confounding variables in such an analysis, these results lend support to their methodology. That is to say, this analysis does not find evidence that Twitter activity may strongly clustered outside the scope of the real-world phenomena it relates to.
Conclusion
While these results are interesting, particularly in relation to Wang et al and Holler, they beg further investigation into the growing body of spatial Twitter analysis. Further research questions could include:
- What degree of clustering can be found in tweets about this metro collapse in the Mexico City area, or Mexico as a whole?
- What do the pockets of increased CDMX metro collapse Twitter activity have in common? What patterns can be found in these locations?
- Are there other sources of confounding that may affect the spatial patterns of Twitter data beyond personal connection to a disaster?
References
Wang, Z., Ye, X., & Tsou, M. (2016, April 30). Spatial, temporal, and content analysis of Twitter for wildfire hazards. Natural Hazards. doi:10.1007/s11069-016-2329-6.
Thank you to Professor Joe Holler, Kufre Udoh, and the rest of the Geog323 class for the collaborative spirit and aid in this project.
Report Template References & License
This template was developed by Peter Kedron and Joseph Holler with funding support from HEGS-2049837. This template is an adaptation of the ReScience Article Template Developed by N.P Rougier, released under a GPL version 3 license and available here: https://github.com/ReScience/template. Copyright © Nicolas Rougier and coauthors. It also draws inspiration from the pre-registration protocol of the Open Science Framework and the replication studies of Camerer et al. (2016, 2018). See https://osf.io/pfdyw/ and https://osf.io/bzm54/
Camerer, C. F., A. Dreber, E. Forsell, T.-H. Ho, J. Huber, M. Johannesson, M. Kirchler, J. Almenberg, A. Altmejd, T. Chan, E. Heikensten, F. Holzmeister, T. Imai, S. Isaksson, G. Nave, T. Pfeiffer, M. Razen, and H. Wu. 2016. Evaluating replicability of laboratory experiments in economics. Science 351 (6280):1433–1436. https://www.sciencemag.org/lookup/doi/10.1126/science.aaf0918.
Camerer, C. F., A. Dreber, F. Holzmeister, T.-H. Ho, J. Huber, M. Johannesson, M. Kirchler, G. Nave, B. A. Nosek, T. Pfeiffer, A. Altmejd, N. Buttrick, T. Chan, Y. Chen, E. Forsell, A. Gampa, E. Heikensten, L. Hummer, T. Imai, S. Isaksson, D. Manfredi, J. Rose, E.-J. Wagenmakers, and H. Wu. 2018. Evaluating the replicability of social science experiments in Nature and Science between 2010 and 2015. Nature Human Behaviour 2 (9):637–644. http://www.nature.com/articles/s41562-018-0399-z.